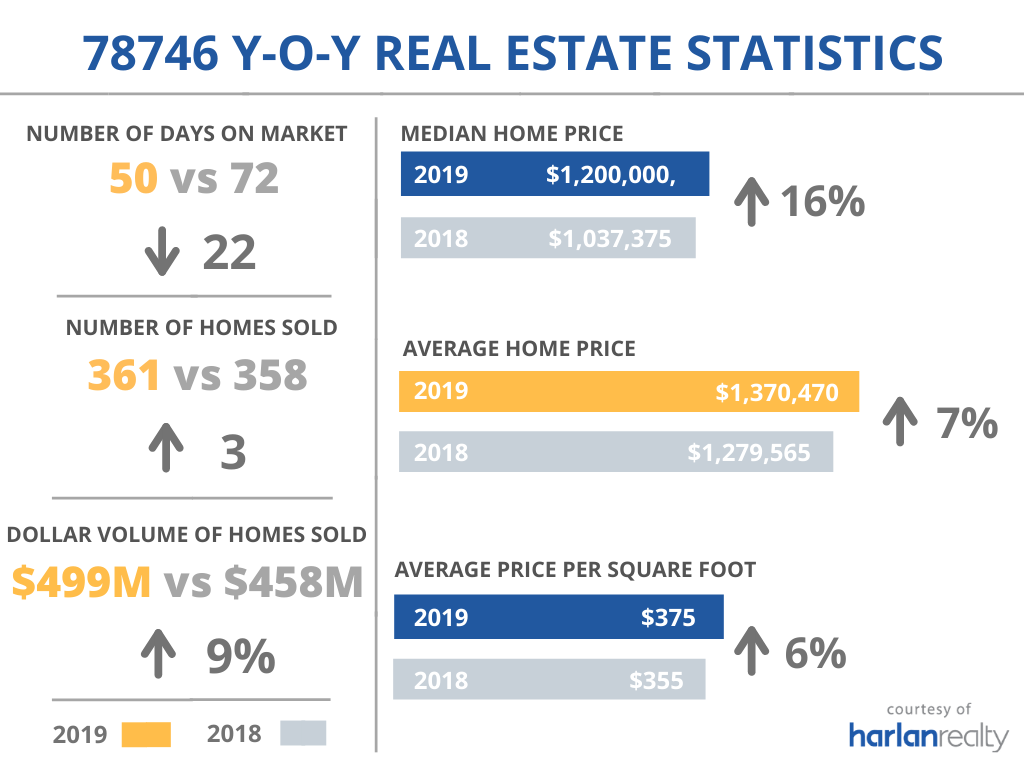
78746 Y-O-Y Neighborhood Breakdown (2019 vs 2018)
Lost Creek Real Estate Statistics
- 54 – Single-family homes sold, 1 more than 2018
- $846,847 – Average price for single-family home, 9% more than 2018
- $299 – Average price per square foot for single-family homes, 3% more than 2018
- 23 – Average number of days single-family homes spent on the market, 5 days less than 2018
West Lake Hills Real Estate Statistics
- 48 – Single-family homes sold, 18 less than 2018
- $1,552,569 – Average price for single-family home, 7% more than 2018
- $454 – Average price per square foot for single-family homes, 11% more than 2018
- 58 – Average number of days single-family homes spent on the market, 24 days less than 2018
Davenport Ranch Real Estate Statistics
- 30 – Single-family homes sold, 4 less than 2018
- $1,304,997 – Average price for single-family home, 14% more than 2018
- $302 – Average price per square foot for single-family homes, 2% more than 2018
- 37 – Average number of days single-family homes spent on the market, 45 days less than 2018
Rob Roy Real Estate Statistics
- 16 – Single-family homes sold, 1 less than 2018
- $1,631,250 – Average price for single-family home, 9% more than 2018
- $345 – Average price per square foot for single-family homes, 6% more than 2018
- 86 – Average number of days single-family homes spent on the market, 30 days less than 2018
Harlan Realty
Are you looking to buy or sell in Westlake? If you are looking for an agent who knows the Westlake market, Harlan Realty agents specialize in helping buyers and sellers in the Westlake area. Contact us today at 512-585-1577.
